For business inquiries : (+971) 561803315
For special requests : (+971) 561803315
For business inquiries : (+971) 561803315
For special requests : (+971) 561803315
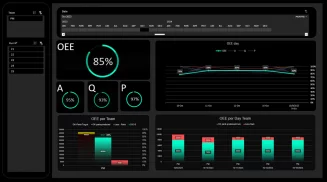
This training program focuses on developing skills in creating effective dashboards and performance indicators using Excel. Participants will learn practical techniques to design, build, and customize dashboards to visualize key performance metrics and facilitate data-driven decision-making.
Module 1: Systematic Dashboard Approach
Selecting Key Performance Indicators (KPIs) systematically.
Determining optimal visualizations for each KPI.
Structuring and organizing dashboard elements effectively.
Creating analytical and predictive views.
Ensuring coherence and consistency across the dashboard.
Module 2: Database Essentials
Structuring data lists efficiently.
Harnessing Excel's "Tables" feature for data organization.
Module 3: Advanced Database Techniques
Extracting data using advanced filtering methods.
Managing matrix databases proficiently.
Applying statistical functions tailored to data lists.
Module 4: Pivot Tables Mastery
Crafting pivot tables with customized calculations and grouping.
Extending pivot tables across multiple datasets.
Implementing custom sorting and filtering techniques.
Utilizing auxiliary tools such as Slicers, Timelines, and dynamic filters.
Enhancing visualization through conditional formatting and performance metrics.
Facilitating interactive data exploration.
Module 5: Pivot Chart Proficiency
Generating pivot charts using the PivotChart Wizard.
Modifying and updating pivot charts seamlessly.
Leveraging the pivot chart toolbar for enhanced functionality.
Configuring calculation, layout, extraction, distribution, and formatting options effectively.
Module 6: Practical Dashboard Applications
Implementing dashboard solutions for various domains:
Financial management.
Operations oversight.
Inventory tracking.
Sales performance analysis.
Production monitoring.
Human resources management.